The days of keyword stuffing and calling it successful SEO are long gone – these days, it takes a lot more to successfully market your content to be seen favourably in the eyes of Google.
One of the most effective ways to climb up search engine rankings is to produce high quality and unique content that attracts links, but where do you begin? In this article, we are going to be taking you through five simple steps which will guarantee business success.
Why are infographics so great for link building?
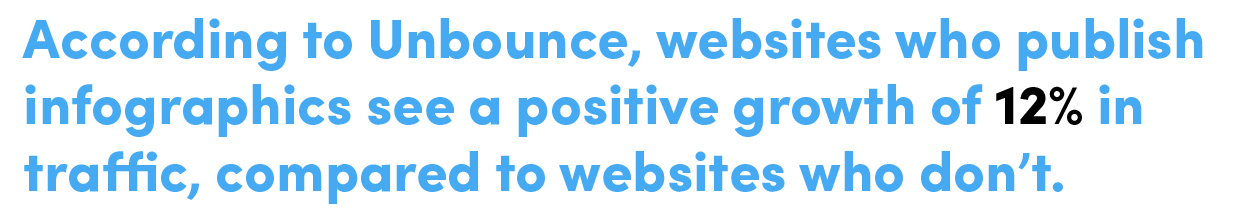
Studies have shown that an audience will remember 65% of the visual content they’ve viewed, in comparison to 10% being remembered from written content. This stat alone should prove just how valuable content marketing can be for your brand.
Infographics, in particular, are an attractive way of packaging data and information; through colour combinations, graphs, icons and imagery. Infographics are ideal for sharing on blogs, websites and social media channels because they have an eye-catching appeal. In fact, this form of content receives three times the engagement of any other social media content. Infographics truly are the ideal linkbait needed to promote your brand.
Information distributed in the form of an infographic often earns more outside links, including editorial and contextual links. Playing up to trending topics and the latest news through your infographic will make you even more likely to get picked up by bloggers and news sites – infographics have the ability to ‘go viral’ when done correctly.
How to build a successful link building campaign using infographics
Step One: Brainstorm and Research
Gathering ideas of what’s appealing to your target audience should be the first stage of any infographic. Whether that idea comes from data, specific niches or events throughout the year, try to look for angles that are more unique and unusual. This ups the chances of your content being shared – you want your infographic to be interesting, easily enhanced by graphics and data, and be relevant to your business. This way, any incoming links will bring with them a host of potential customers. The perfect tool for finding trending articles is Buzzsumo.
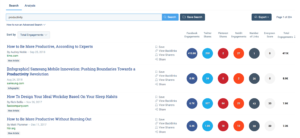
Buzzsumo allows you to view the top trending content on the web, using social engagement as a metric. From here, you can focus on researching the topic and gathering data that can be used in the infographic itself. Focus on verifiable statistics that can be cited and ensure you have plenty of information that can be easily organised and broken down into tweetable statements. Also, try to focus on content that triggers an emotional response within your audience.
Step Two: Develop the Concept
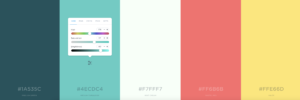
Once you’ve researched the subject, develop it by considering how the data can be represented in a visual way. Start to think about the colour themes you want to use. Our design team use Coolors to assist with this process; one of the best tools to use when choosing a beautiful colour palette.
As well as choosing a colour palette, ask yourself the following questions:
👥 What will best suit your target market?
🤩 How can this information create an emotional response?
😂 Are there ways to add humour?
📤 What makes this content shareable?
These questions are often where your infographic can fall short – having a cool concept is one thing, but if you can’t cater to your target market with the end result, it will fall flat.
Step Three: Design
There are so many ways in which infographics can be created; you don’t even need a whole design team to get the ball rolling. Bringing your visual approach to life will guarantee links; but if it doesn’t make you say wow, it’s not shareable enough. The design needs to suit the tone of the information but be fun and interesting at the same time.

Step Four: Share the Infographic
All of the steps so far have been in preparation for this – sharing the content. Good content, combined with strong link building outreach, can provide amazing results. Whether you write an accompanying blog post or just upload the infographic alone, a key point is to include the embed code that makes it easy for people to share the infographic. By doing so, you’re allowing yourself to gain links back to your site.
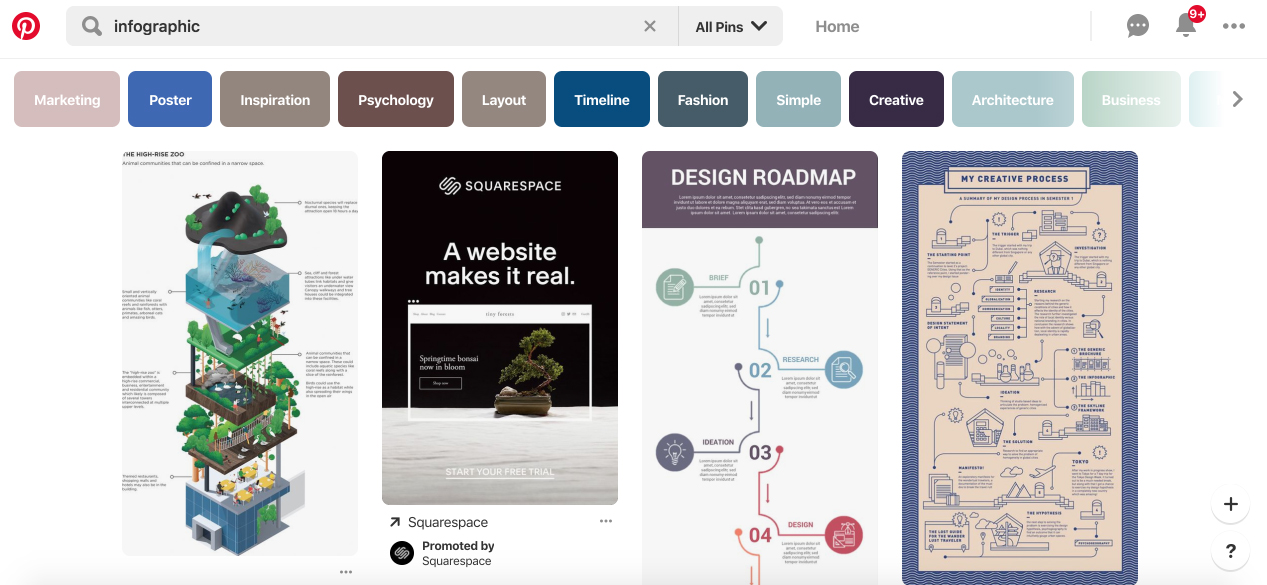
There are various ways to share your infographic, from publishing it via social media (with relevant hashtags) to sending off engaging press releases to reputable websites. Don’t forget that sites like Pinterest and Reddit are also prime locations for visual content, too.
Lastly, you could contact the sources mentioned in your content and let them know about it – they’ll likely be glad to share it, bringing you even more beneficial inbound links.
Step Five: Track and Follow Up
Monitoring infographic coverage will help you to gain new ideas for creative pieces going forward, so you can start the process all over again with a new topic. Set up tracking for your landing page in your analytics software so you can see where the traffic is coming from.
As well as this, it’s worth performing a second round of outreach and sending a friendly email to sites who have not linked back to you.
Are you ready to use infographics to boost your brand’s coverage?
Infographics can be created as stand-alone content or to enhance existing content on your site, but however they’re used, they’re an important part of a marketer’s strategy. Compared to traditional blog posts, infographics have the ability to be more widely shared and serve as a potential goldmine for building links back to your site.
If you would like a team of creatives to do the work for you and create a striking infographic which will guarantee shares, then get in touch with us today.